
Nasdaq Dorsey Wright Fund Scores
Fund Scores
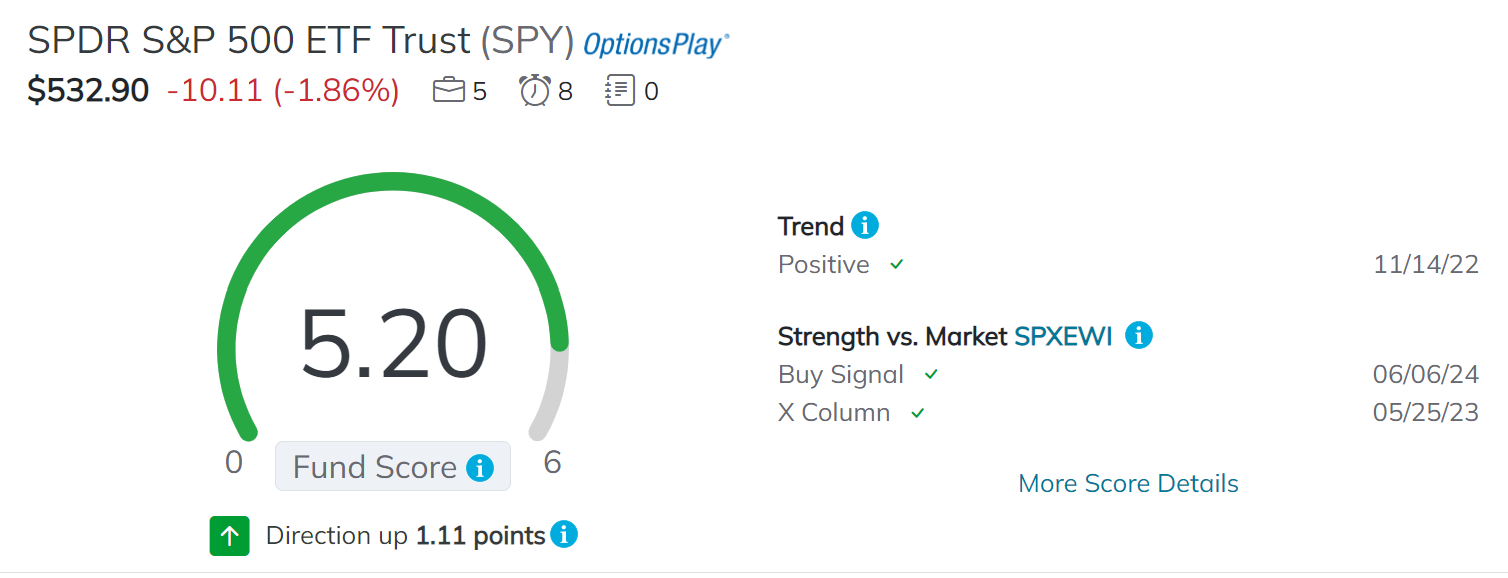
Nasdaq Dorsey Wright's (NDW's) Fund Scores are exactly what the name implies, a rating system for the ETFs and mutual funds. A fund's score acts as a method of summarizing the strength of that fund based on trend and Relative Strength measures to easily identify funds with a positive technical outlook.
Fund Scores allows us to easily leverage NDW's technical expertise via a simple, easily understood value. Ultimately, fund scores allow us to identify changing dynamics within a fund universe in order to develop a rules-based process for remaining invested in areas of strength within the market.
Fund Score Components
There is no secret to what variables are included in NDW's Fund Score calculation. This means you can easily determine what is positively contributing to its score and what variables are preventing it from achieving a higher score.
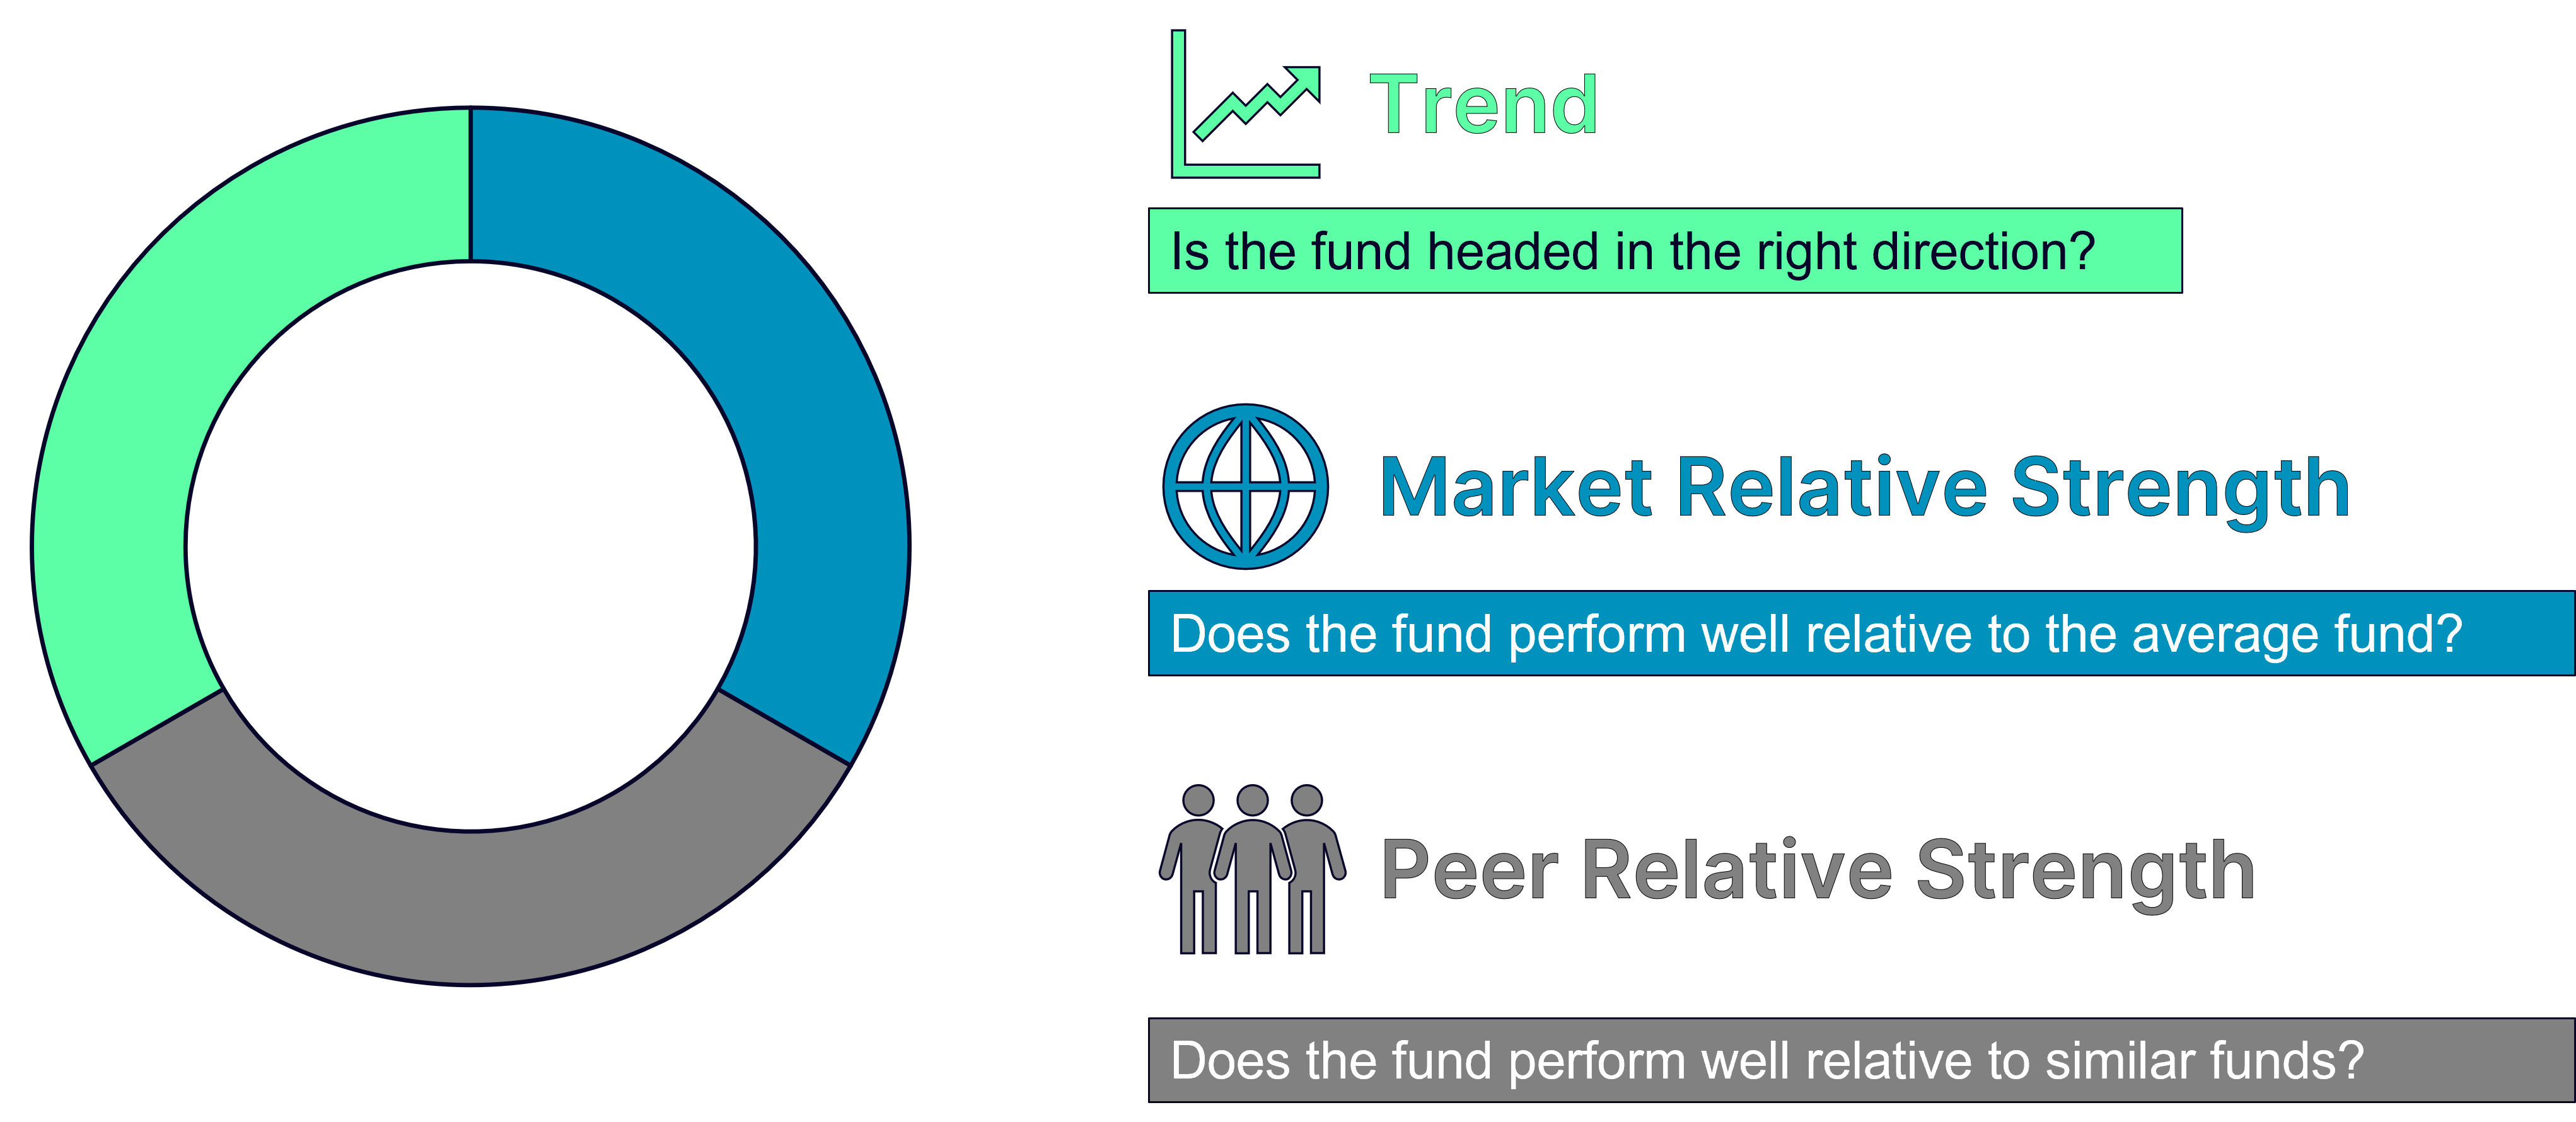
Fund Scores are comprised of trend, market relative strength, and peer relative strength characteristics. However, Fund Scores incorporate additional variables to calculate each of those three components.
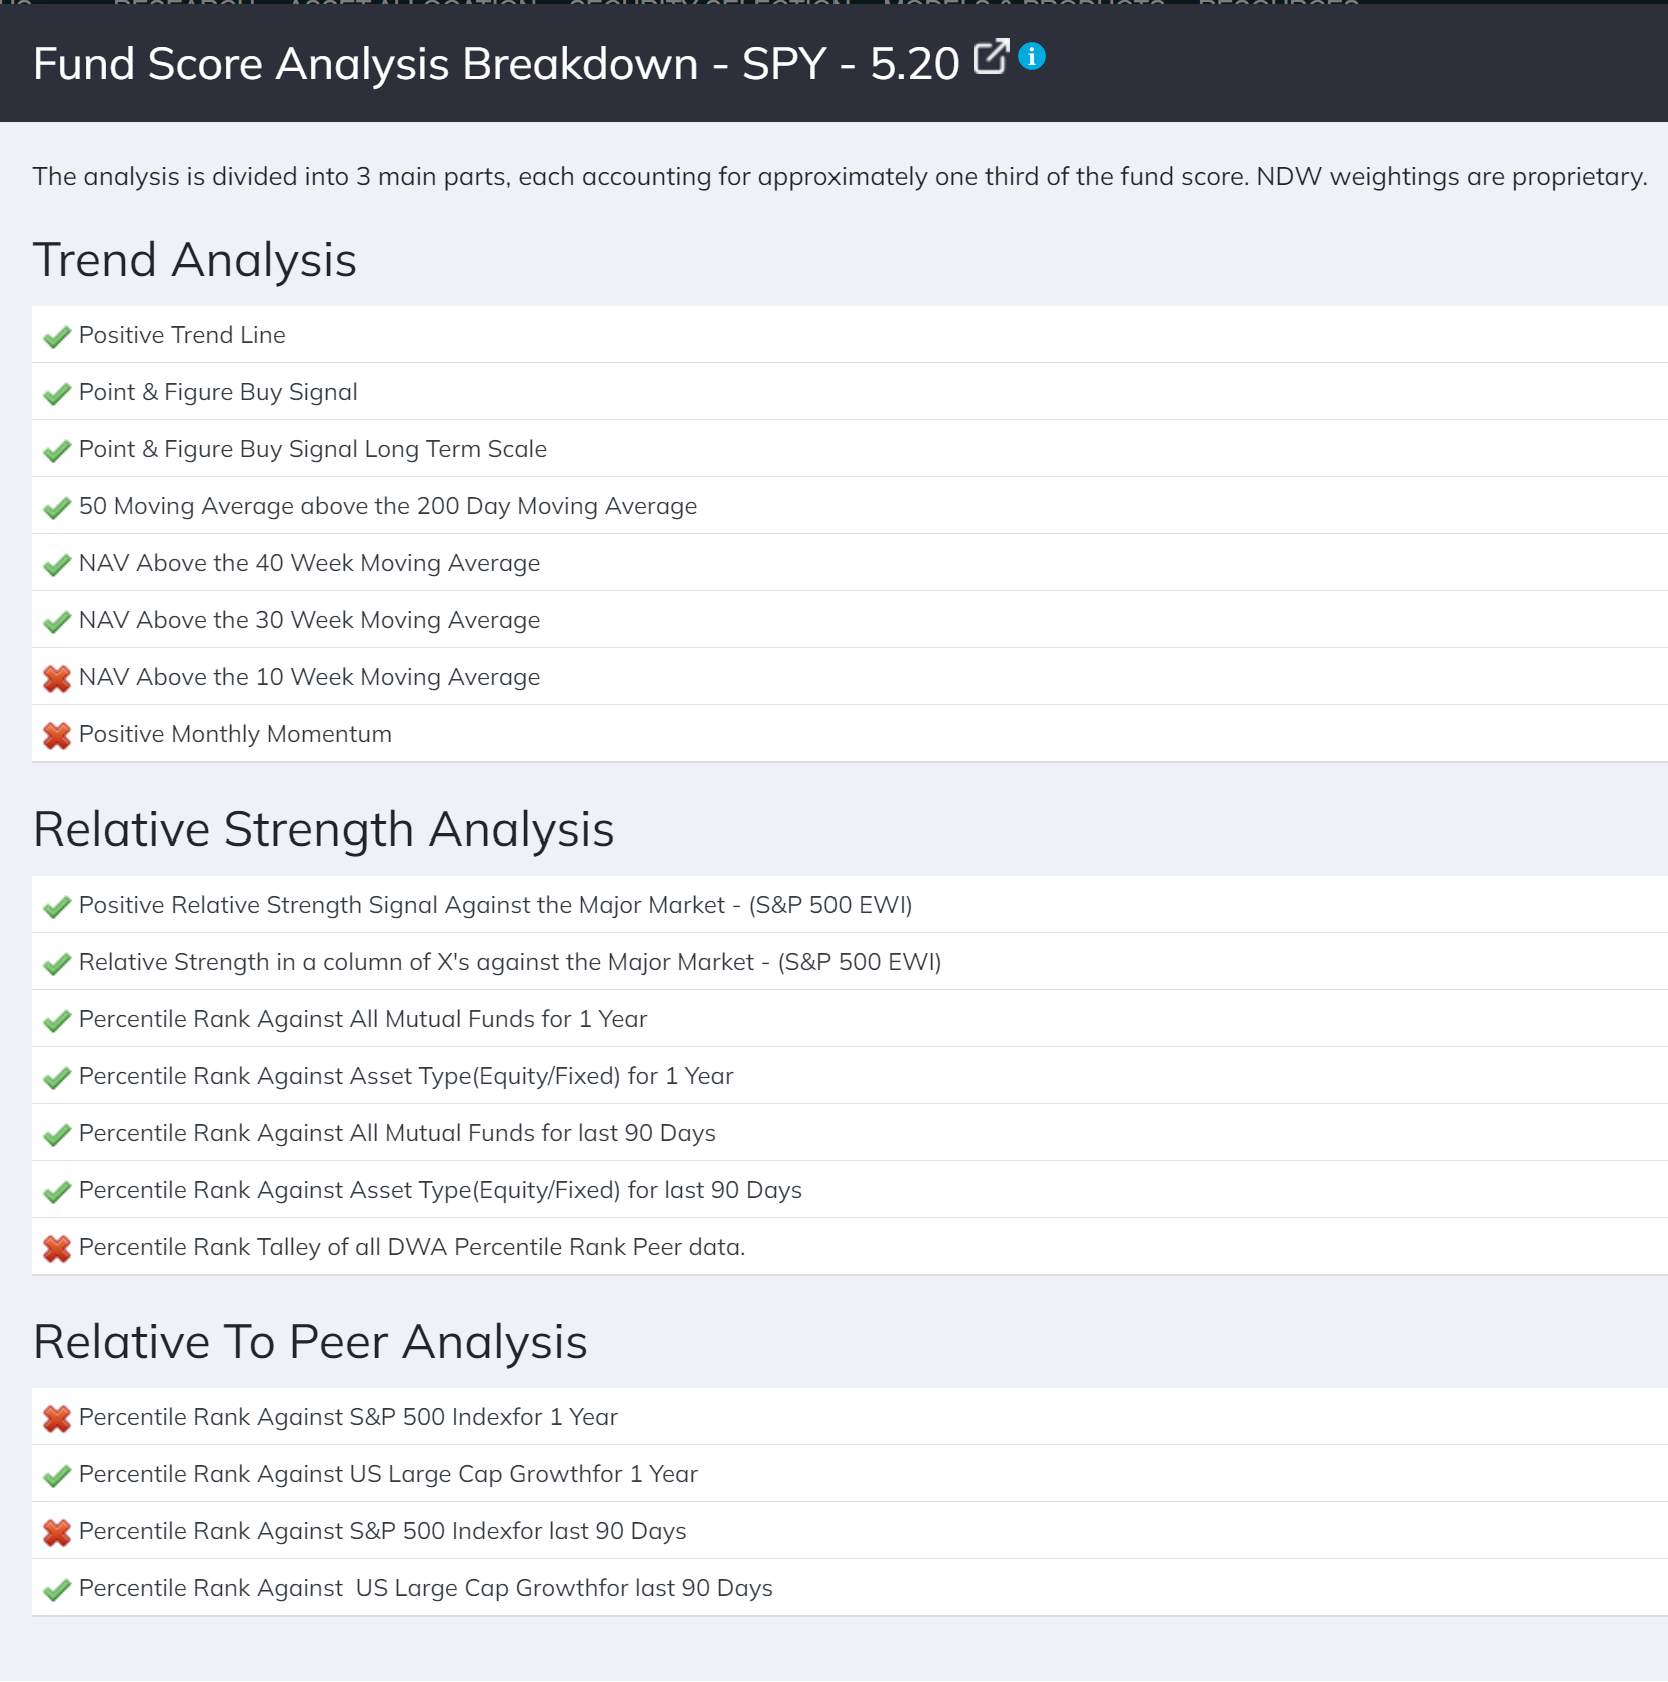
There are 19 variables in total that combine to form Fund Scores; with Trend, Market Relative Strength, and Peer Relative Strength each representing a third of the possible score. These variables include moving average measures in order to capture additional trend information and a number of relative strength comparisons to measure that fund against peers in multiple market segments.
Based off these calculations, Fund Scores create a list of preferred characteristics to help decide between one fund or another. Conceptually, Fund Scores enable us to quickly and easily digest the information contained through point and figure charts to make decisions about our investment preferences.
Trend
Of the 19 variables that go into the Fund Score calculation, 8 are related to Trend.
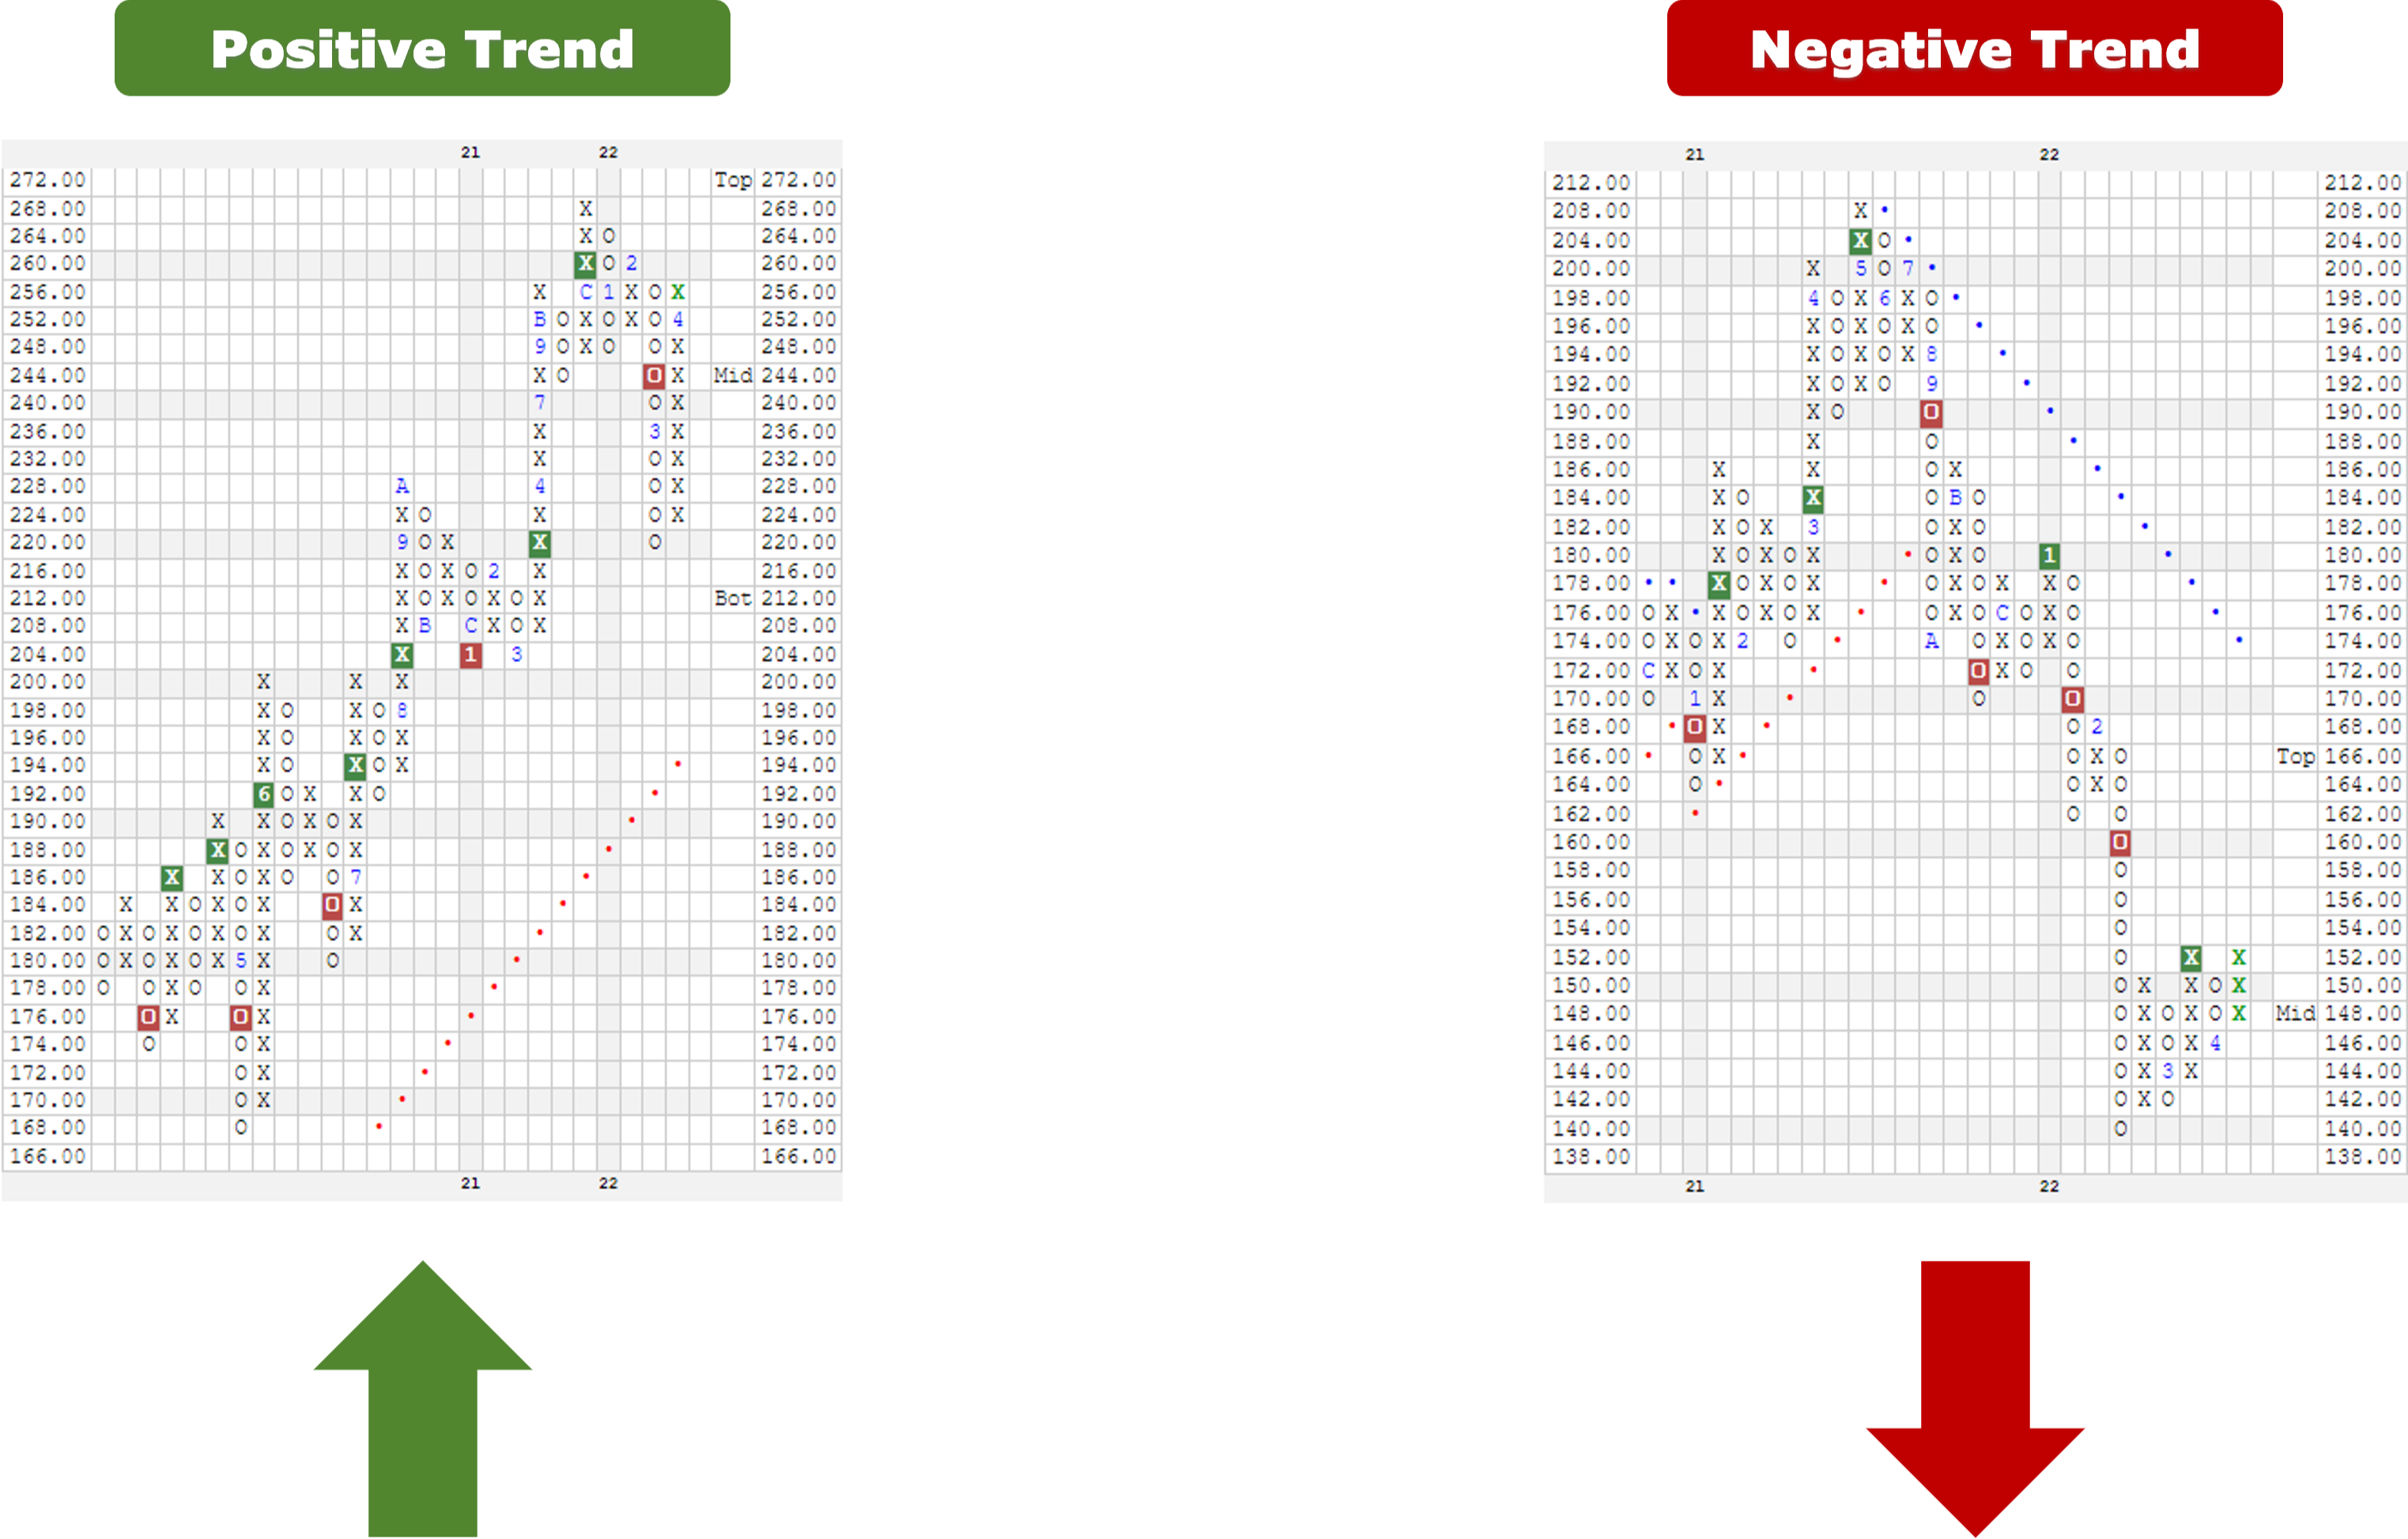
First is the fund’s trend on its chart. All else equal, a positive trend will result in a higher Fund Score, and a negative trend will result in a lower Fund Score.
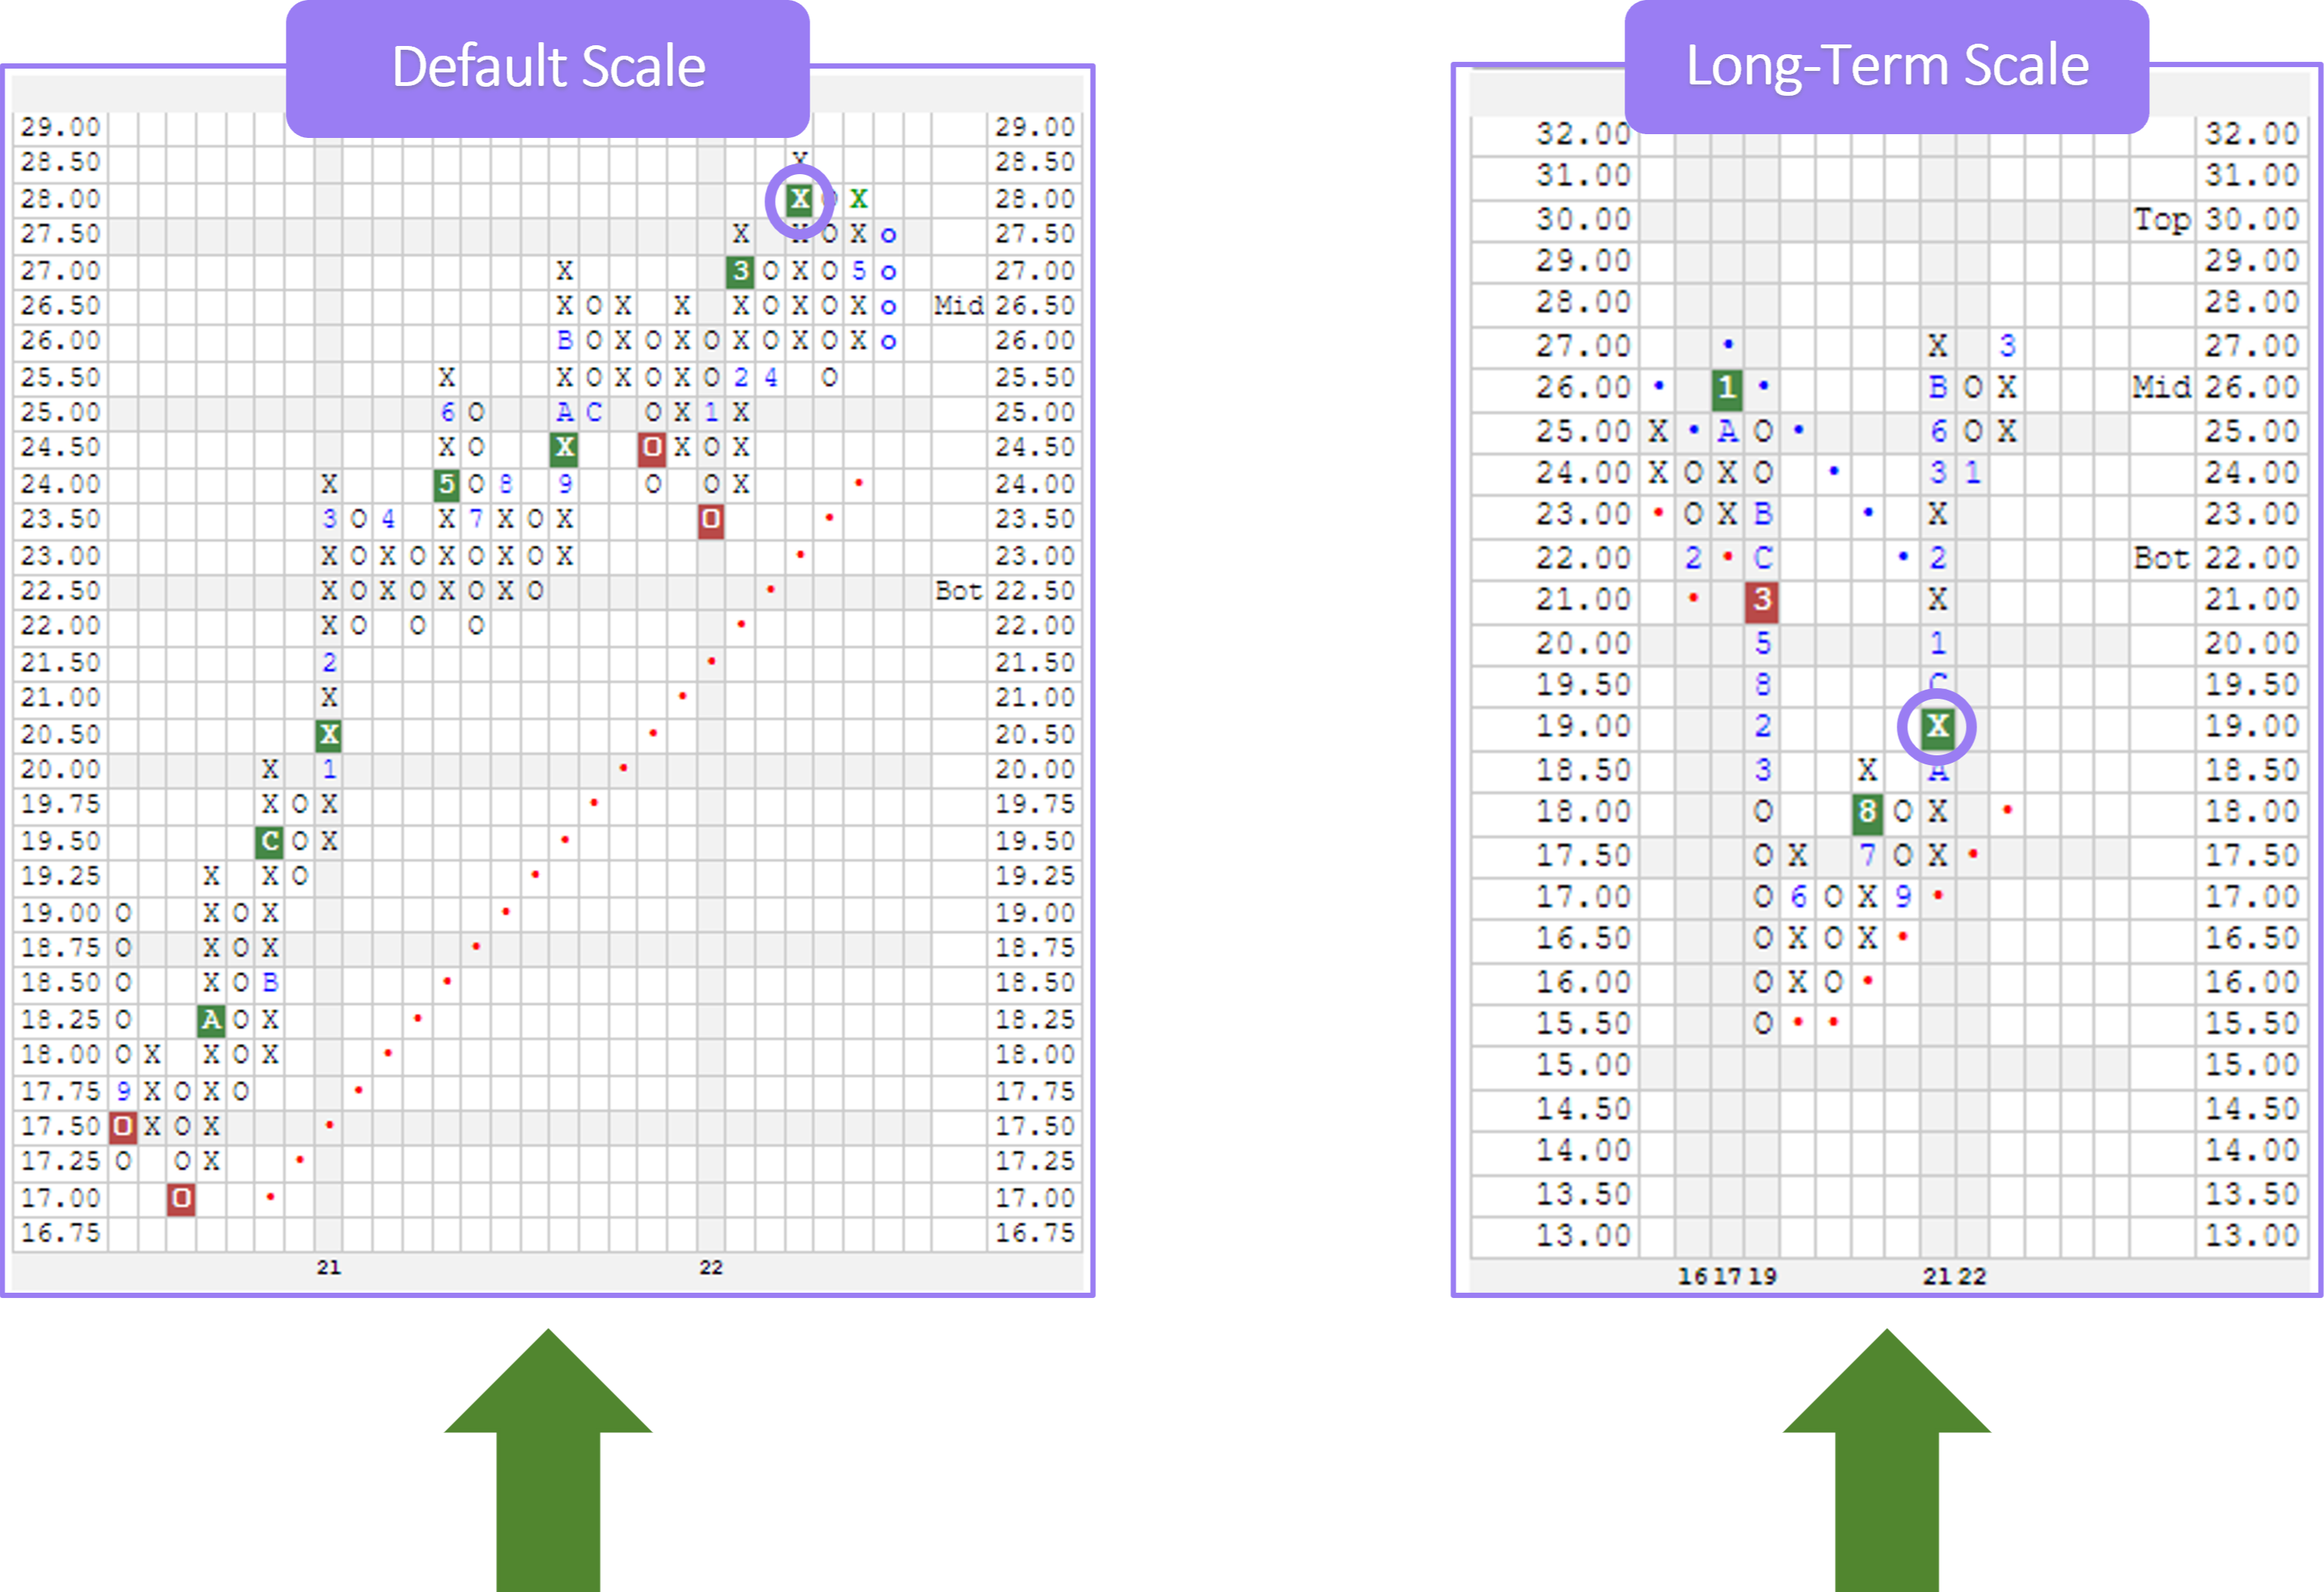
Next, NDW considers the fund’s current signal on both the fund’s default chart and its long-term chart. A long-term chart is created by using a larger scale to plot the fund’s price movement. This reduces the volatility shown in the chart and allows us to focus on longer-term price movement.
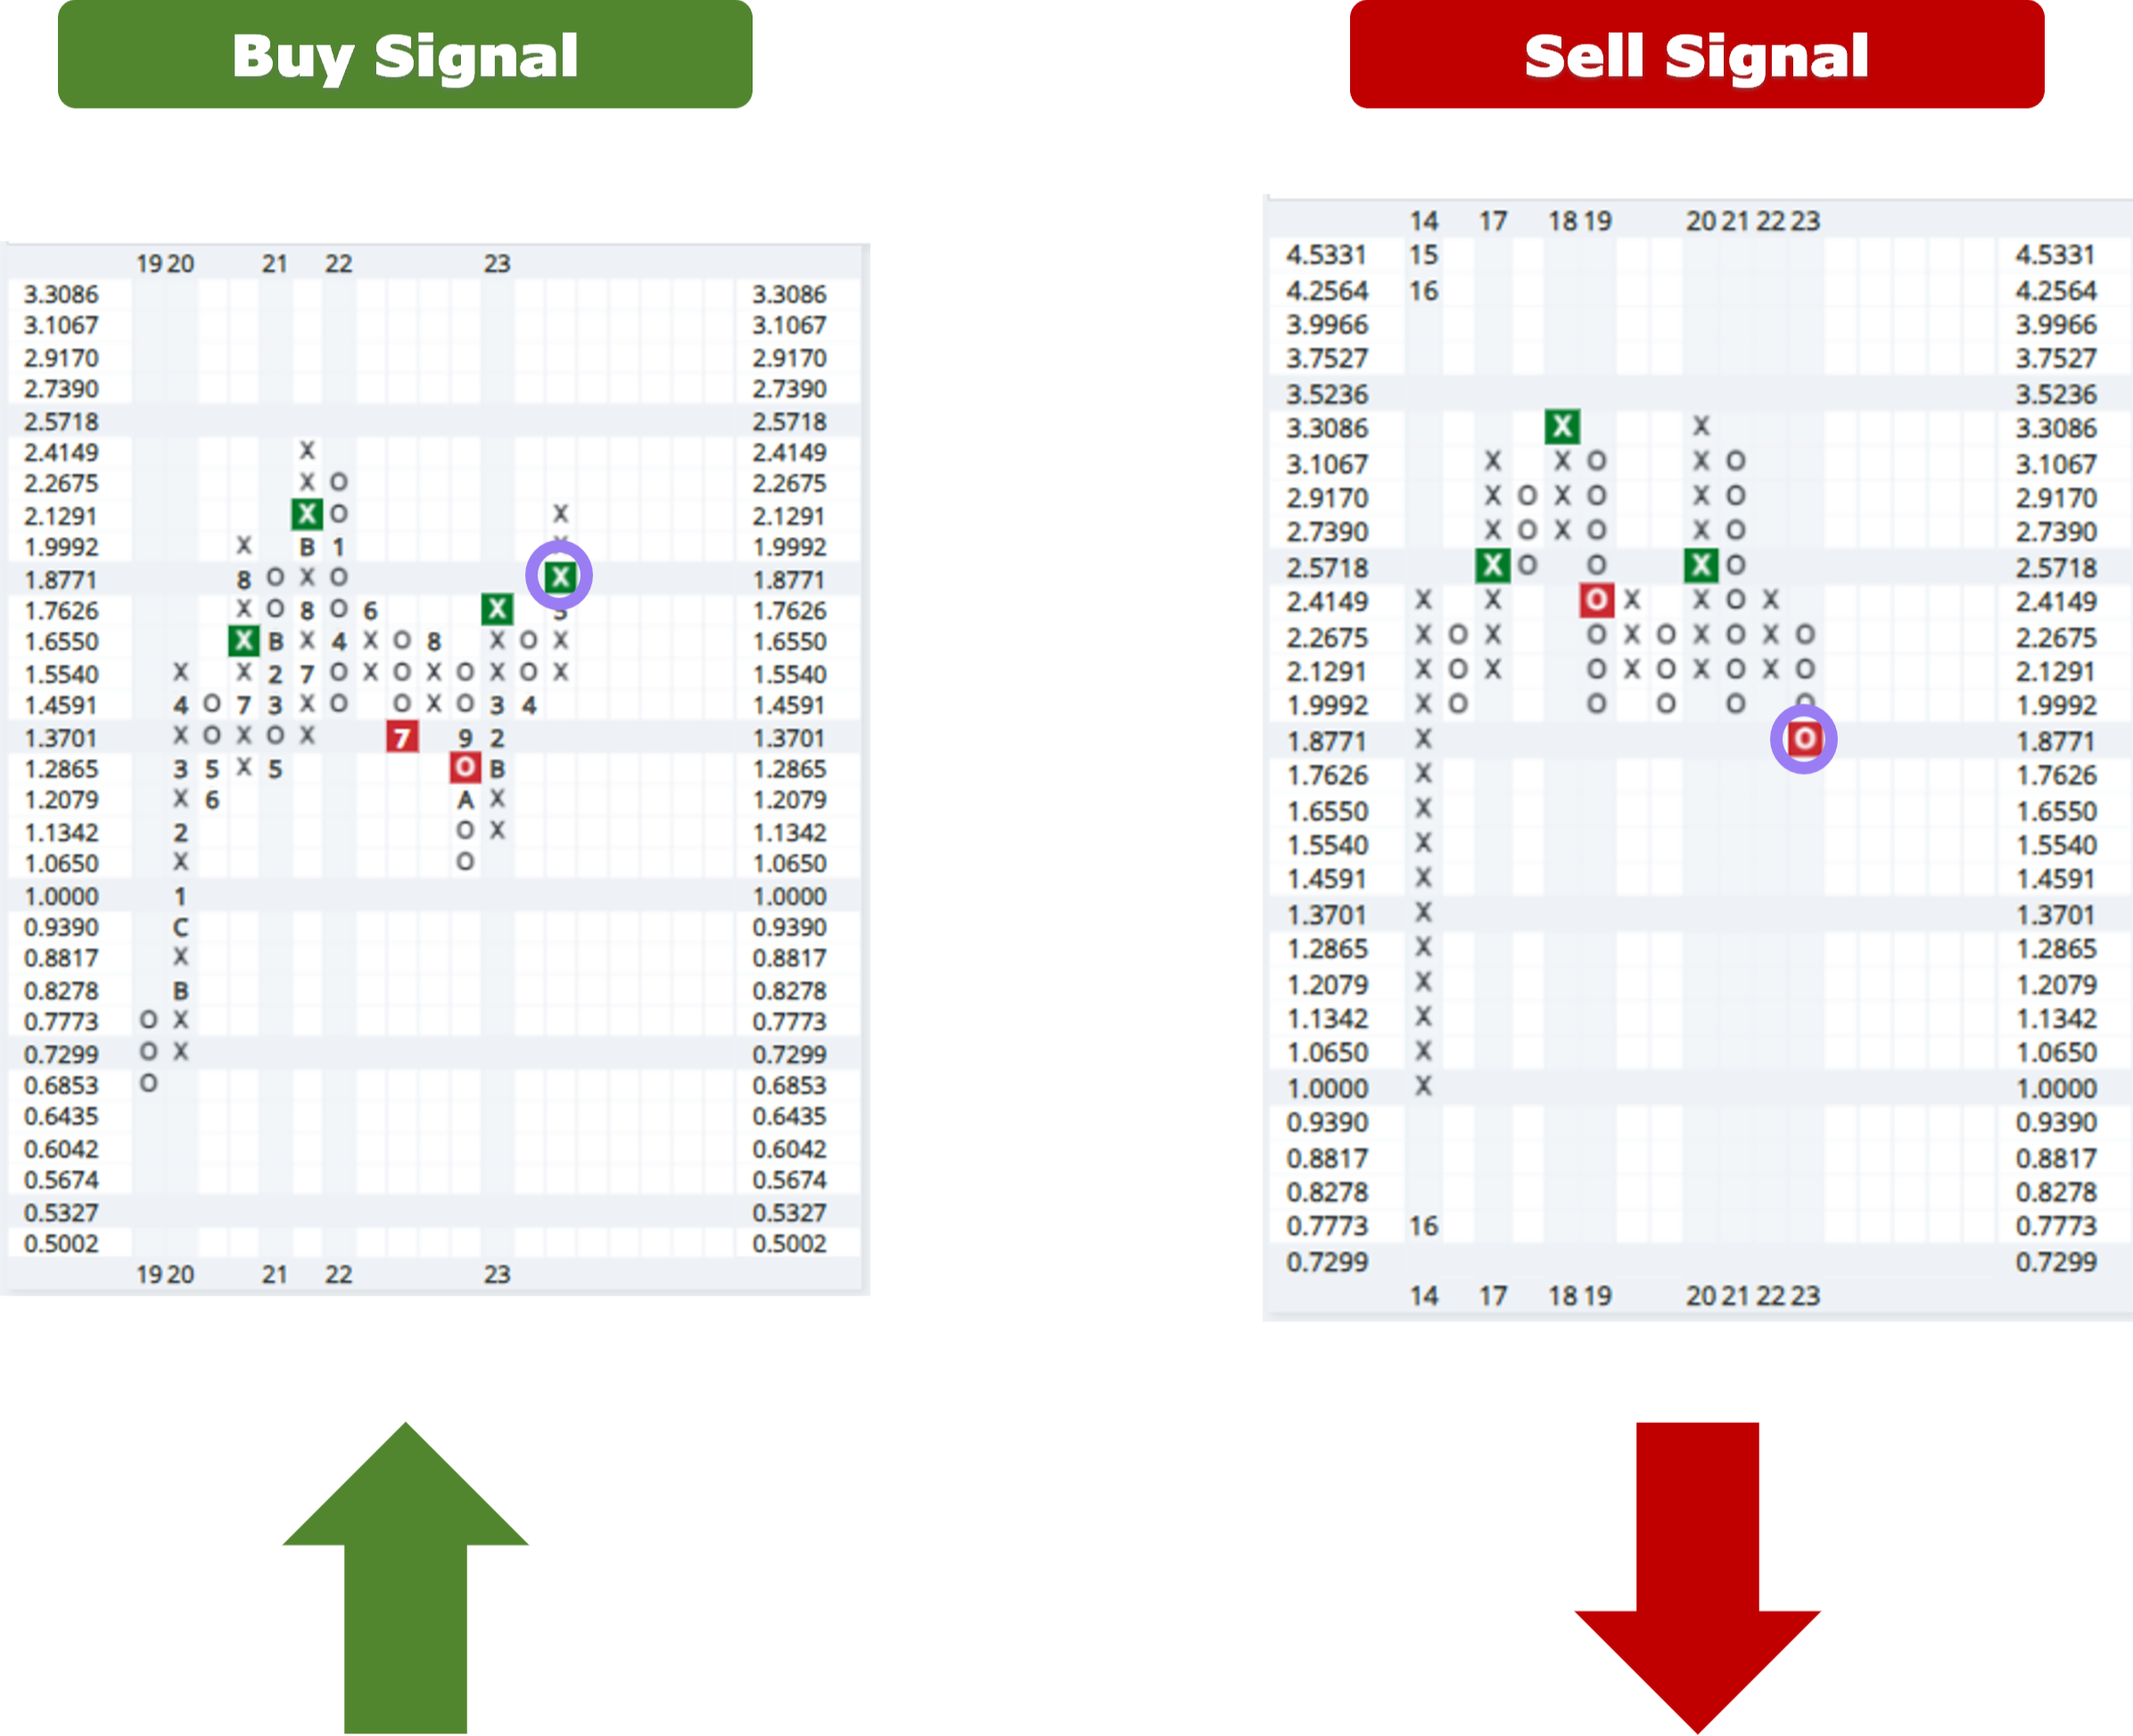
In the Fund Score calculation, each chart is considered separately. In the case of this fund, it’s most recent signals on both its default and long-term chart are buy signals. Each of these would contribute positively to the fund’s overall score.
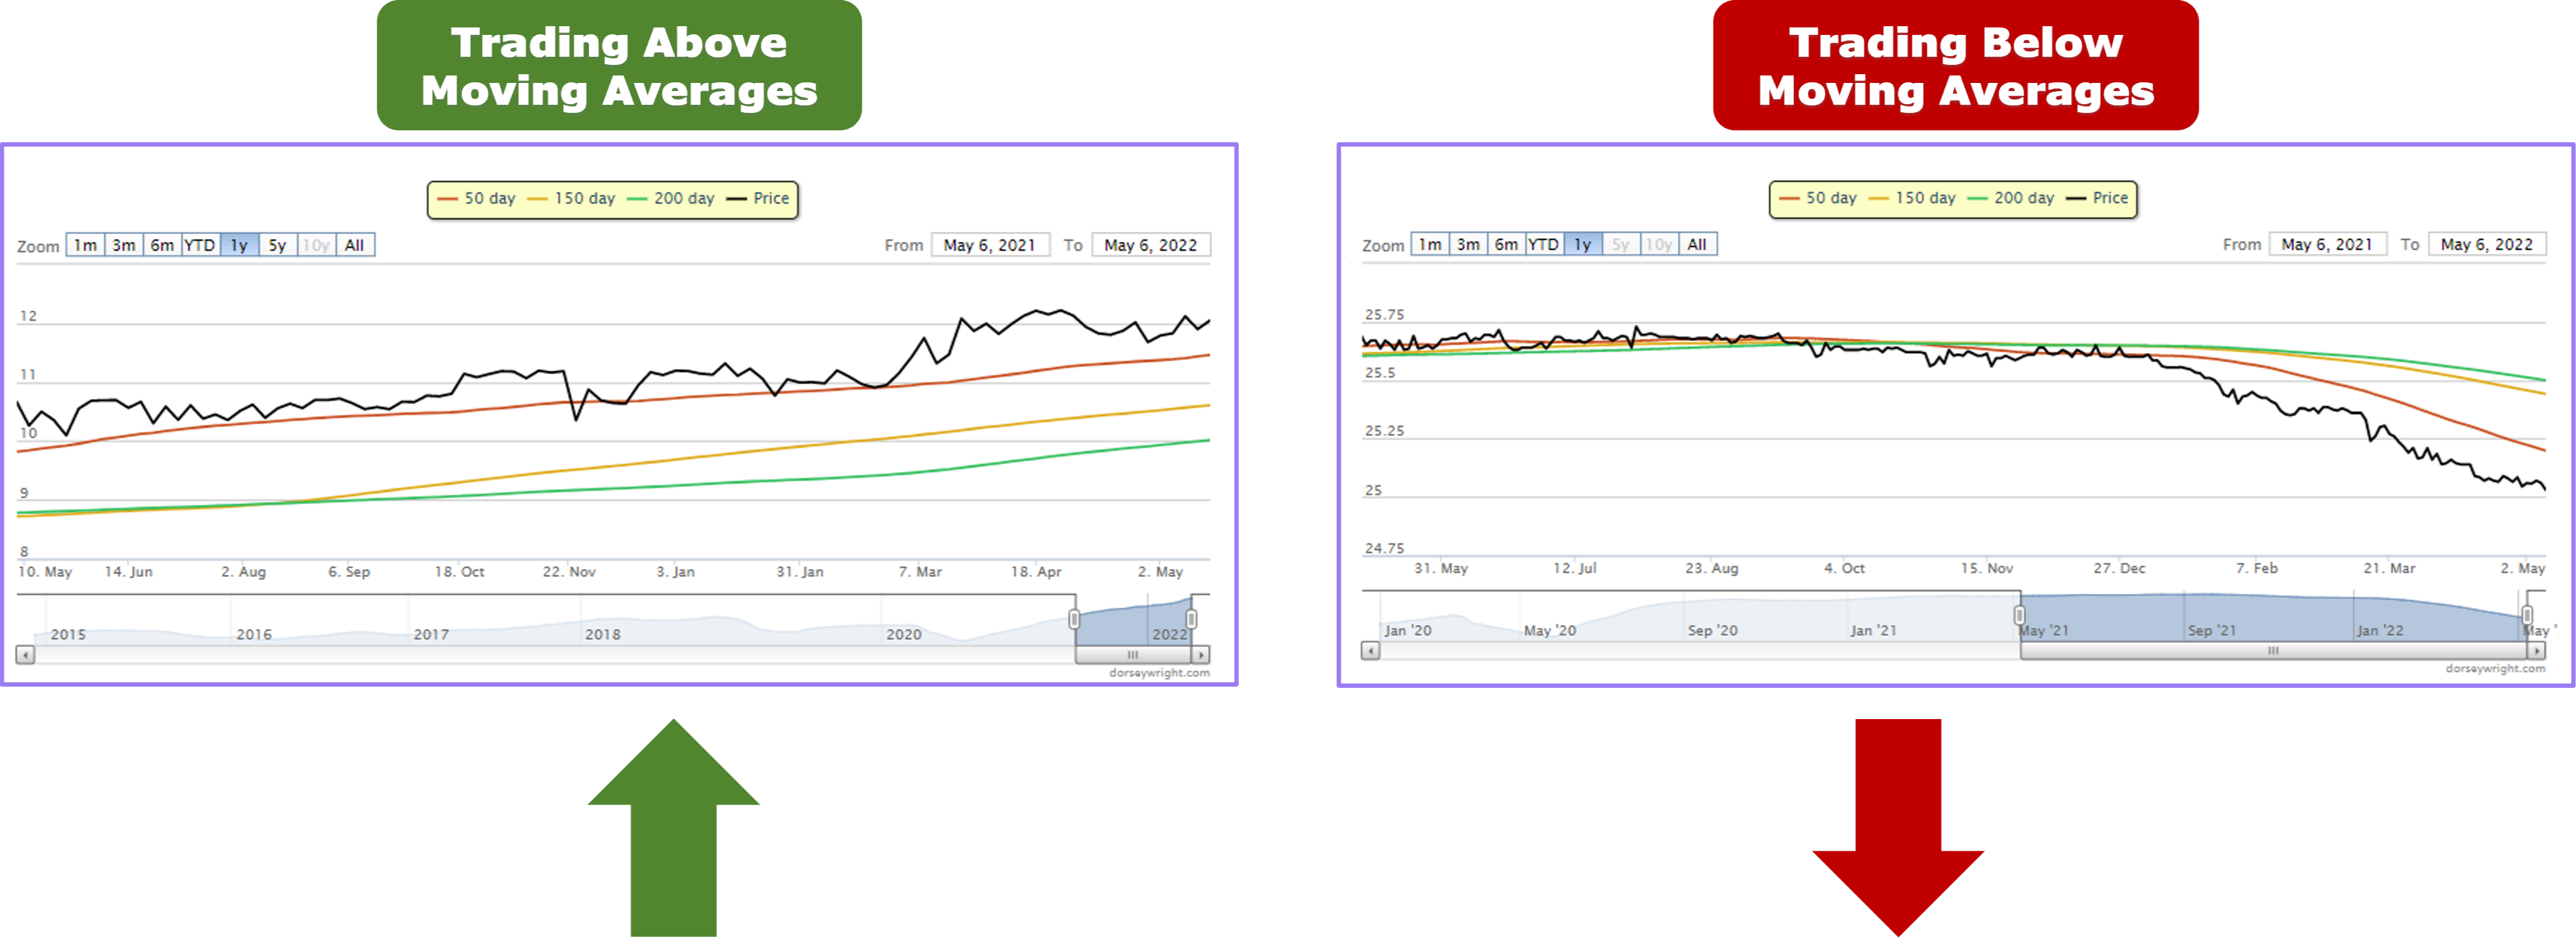
Next, the Fund Score considers the fund’s price relative to various moving averages. We want to see a fund trading above its moving averages since this is a sign of continued strength and positive momentum. There are four variables in the fund score calculation related to these moving averages, which are each considered independently when calculating a fund's score.
All else equal, the fund on the left, which is trading above its moving averages, would have a higher Fund Score than the fund on the right, which is trading below its moving averages.
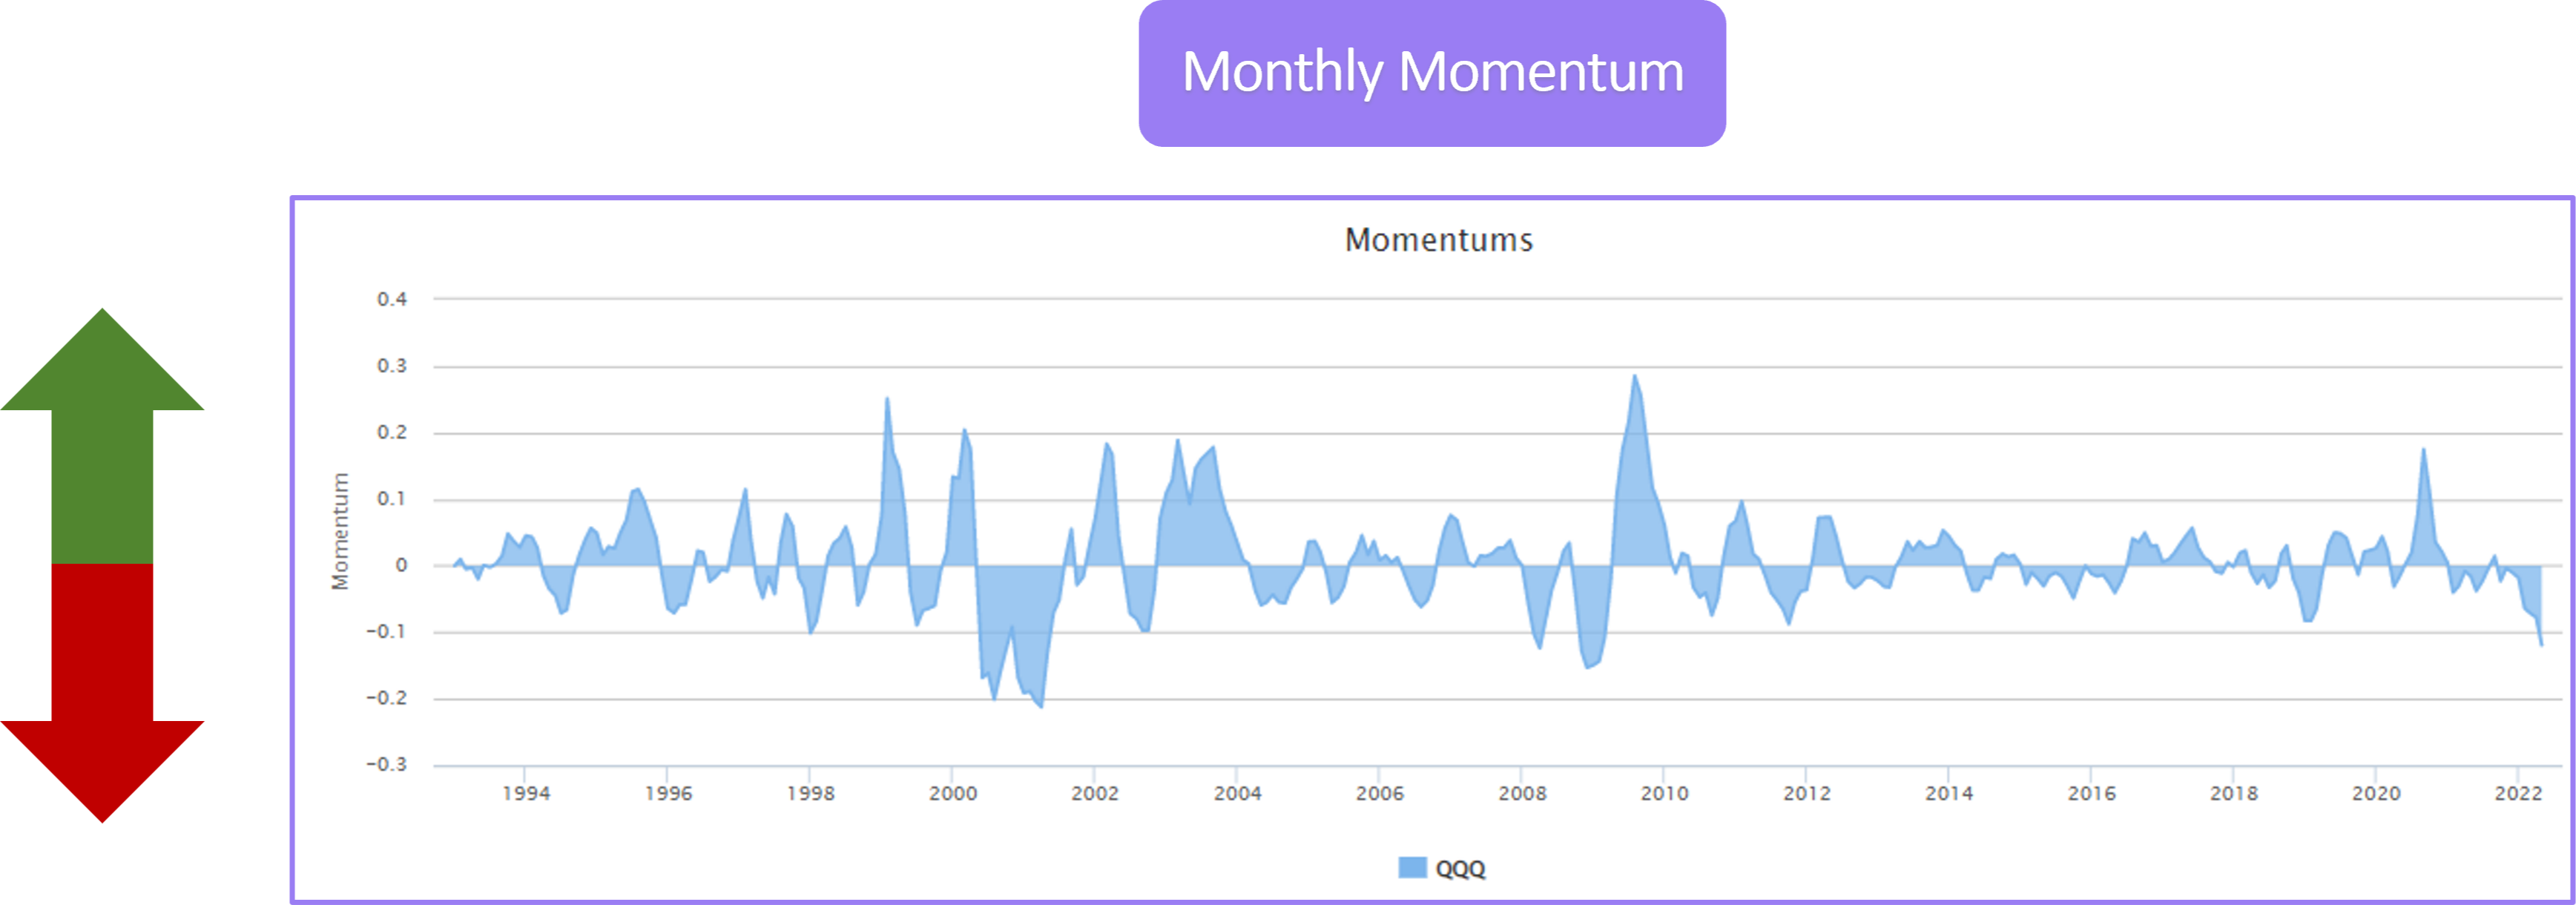
Lastly, the fund’s monthly momentum is considered, which looks at the relationship between a short-term moving average and a long-term moving average. If the fund’s shorter-term moving average is higher than the fund’s longer-term moving average, it is said to have positive monthly momentum. All else equal, a fund with positive monthly momentum will have a higher score than a fund with negative monthly momentum.
Each of the trend-related variables help us identify funds that are continuing to show upward price momentum and help us differentiate funds that are showing continued strength from those whose trend may have stalled out.
Market Relative Strength
The purpose of Relative Strength is to find securities that have demonstrated the ability to outperform the market as we believe these securities represent the best chance of continuing to outperform going forward. When Market Relative Strength is considered in the calculation of NDW's Fund Scores, we want to know if a fund has demonstrated the ability to outperform a broad universe of funds or if we might be better off searching for leadership among the other funds in that universe.
Of the 19 variables that go into the Fund Score, 7 are related to Market Relative Strength.
First, the fund’s current Relative Strength status vs a broad market benchmark is considered by looking at its current signal and column on its market RS chart, which respectively indicate a fund's long-term and intermediate term Relative Strength against the market.
All else equal, a fund on a relative buy signal vs. the market will have a higher score than a fund on a sell signal vs the market.
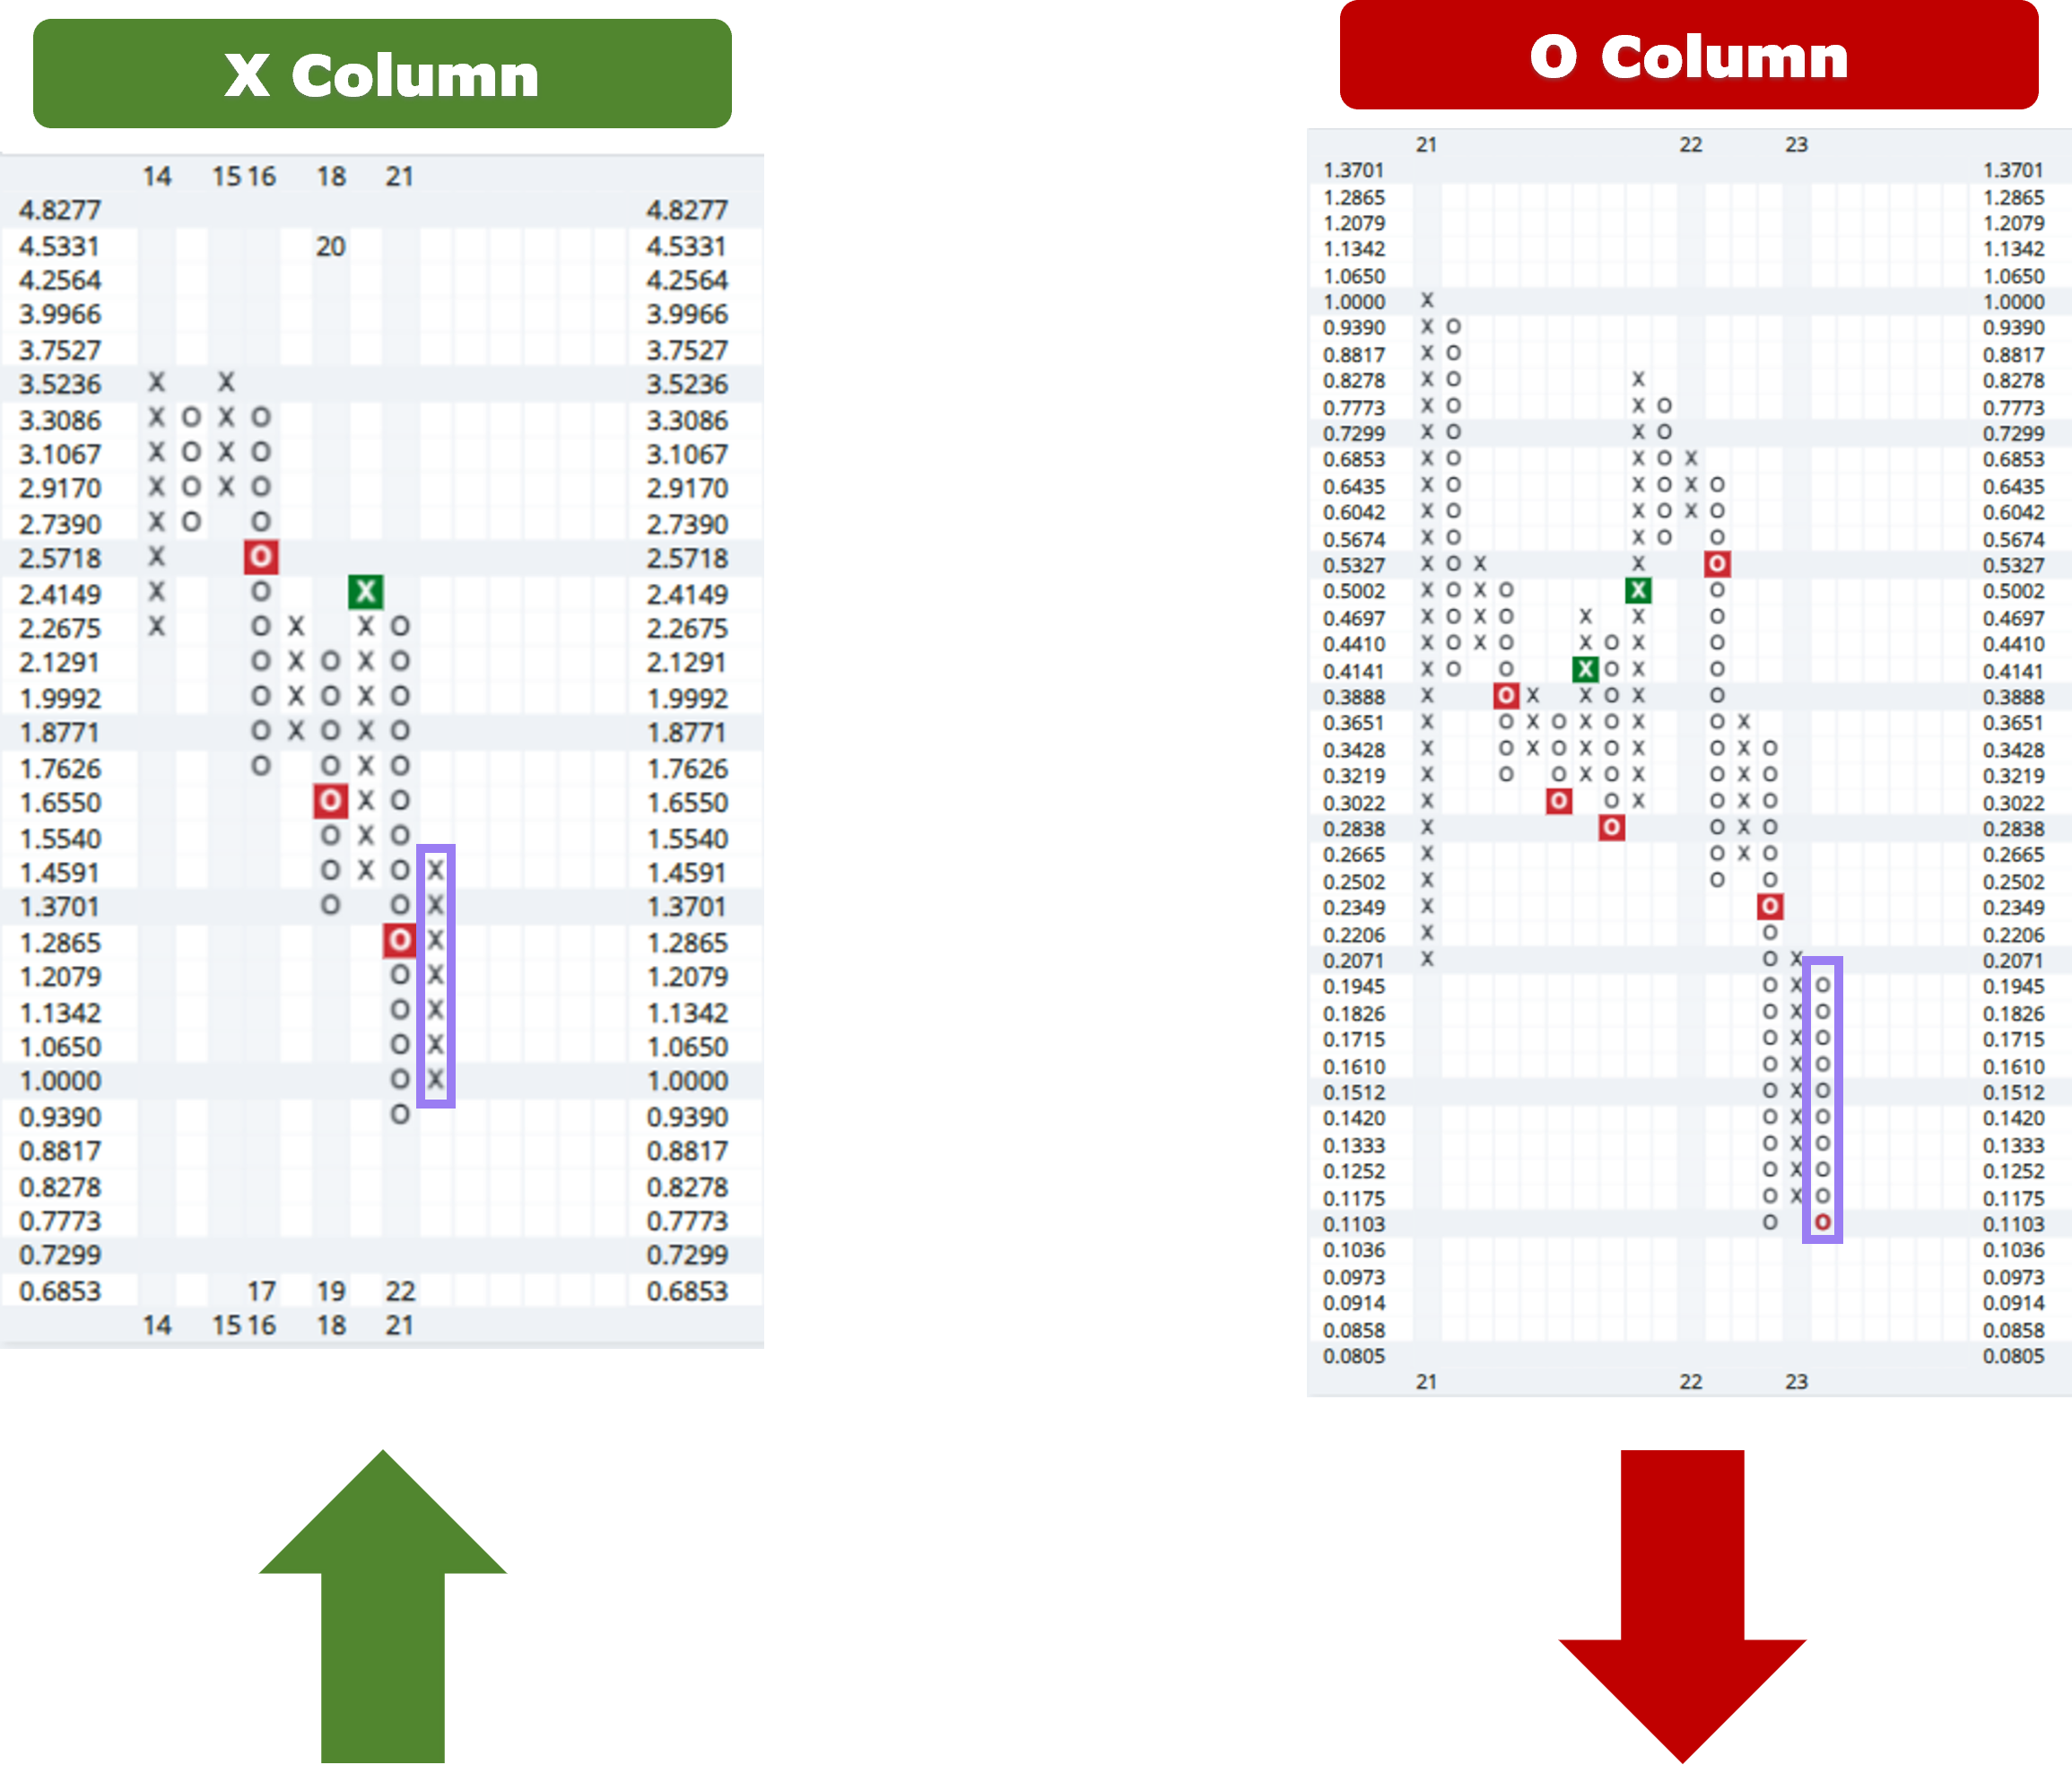
Similarly, a fund in a column of Xs on its market RS chart will have a higher score than a fund in a column of Os with all else equal.
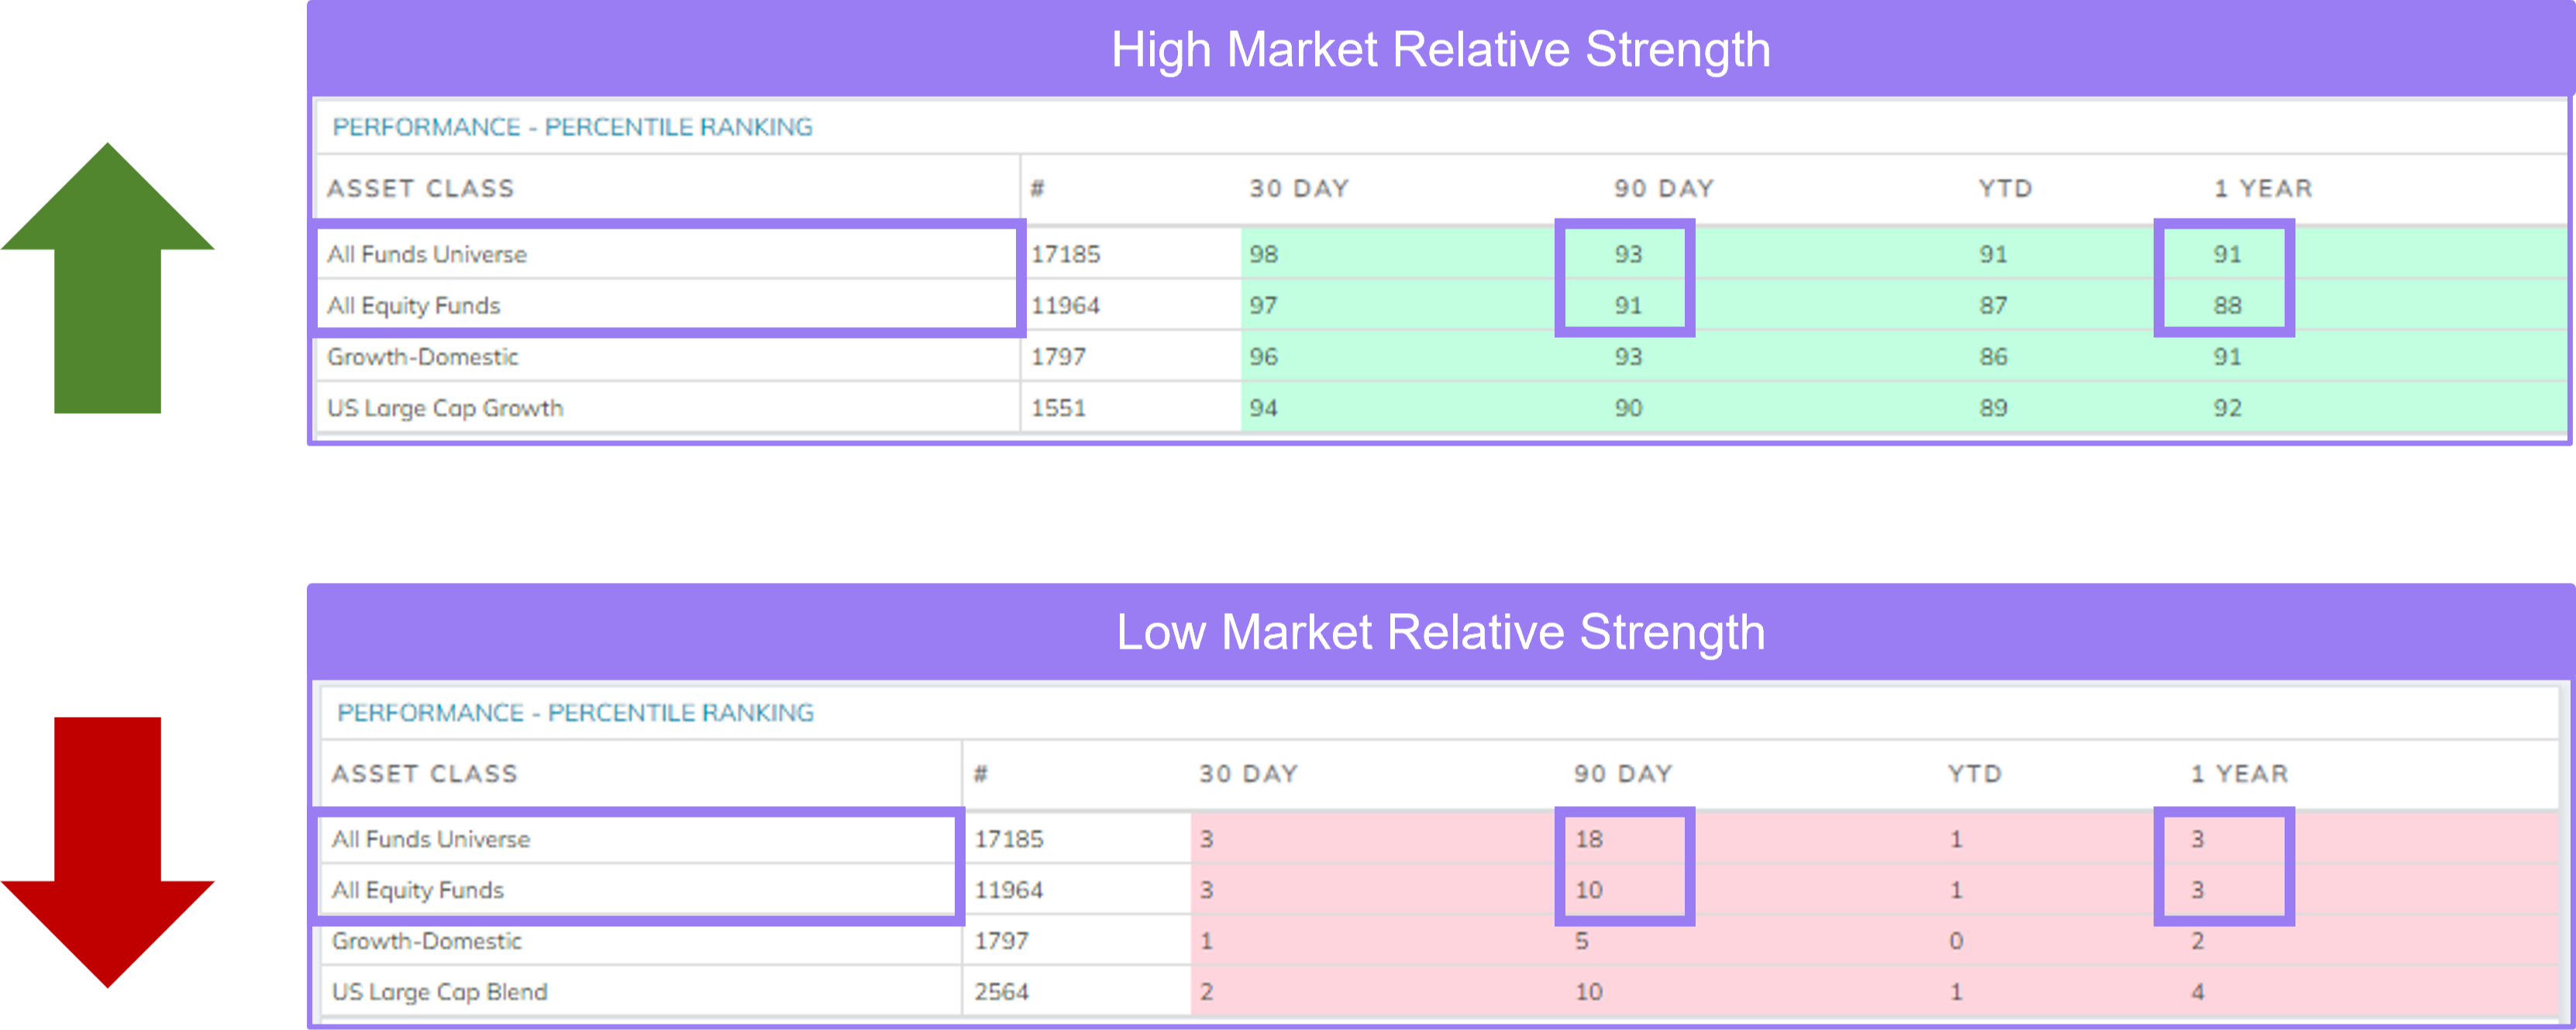
Next, the fund’s relative performance over the last year and the last 90 days vs all funds in total and all funds in the same asset class is evaluated. The numbers shown here are the fund’s percentile rankings within that universe. All else equal, the fund shown here on the top will have a higher score than the fund on the bottom since it has performed better relative to other funds over the last 90 days and the last year.
The last Market Relative Strength component of a fund’s score is an aggregation of the fund’s ranking versus various fund groups. This allows us to slice up the larger universe of all funds into smaller groups to see if this fund is consistently outperforming other groups of funds or if its outperformance is more limited. A fund that compares favorably to more peer groups will have a higher Fund Score, all else equal.
Peer Relative Strength
Peer Relative Strength is then used to dive deeper into the various market segments to compare like securities, allowing us to compare funds on more of an apples-to-apples basis.
Of the 19 variables used to calculate a fund's score, 4 are related to Peer Relative Strength.
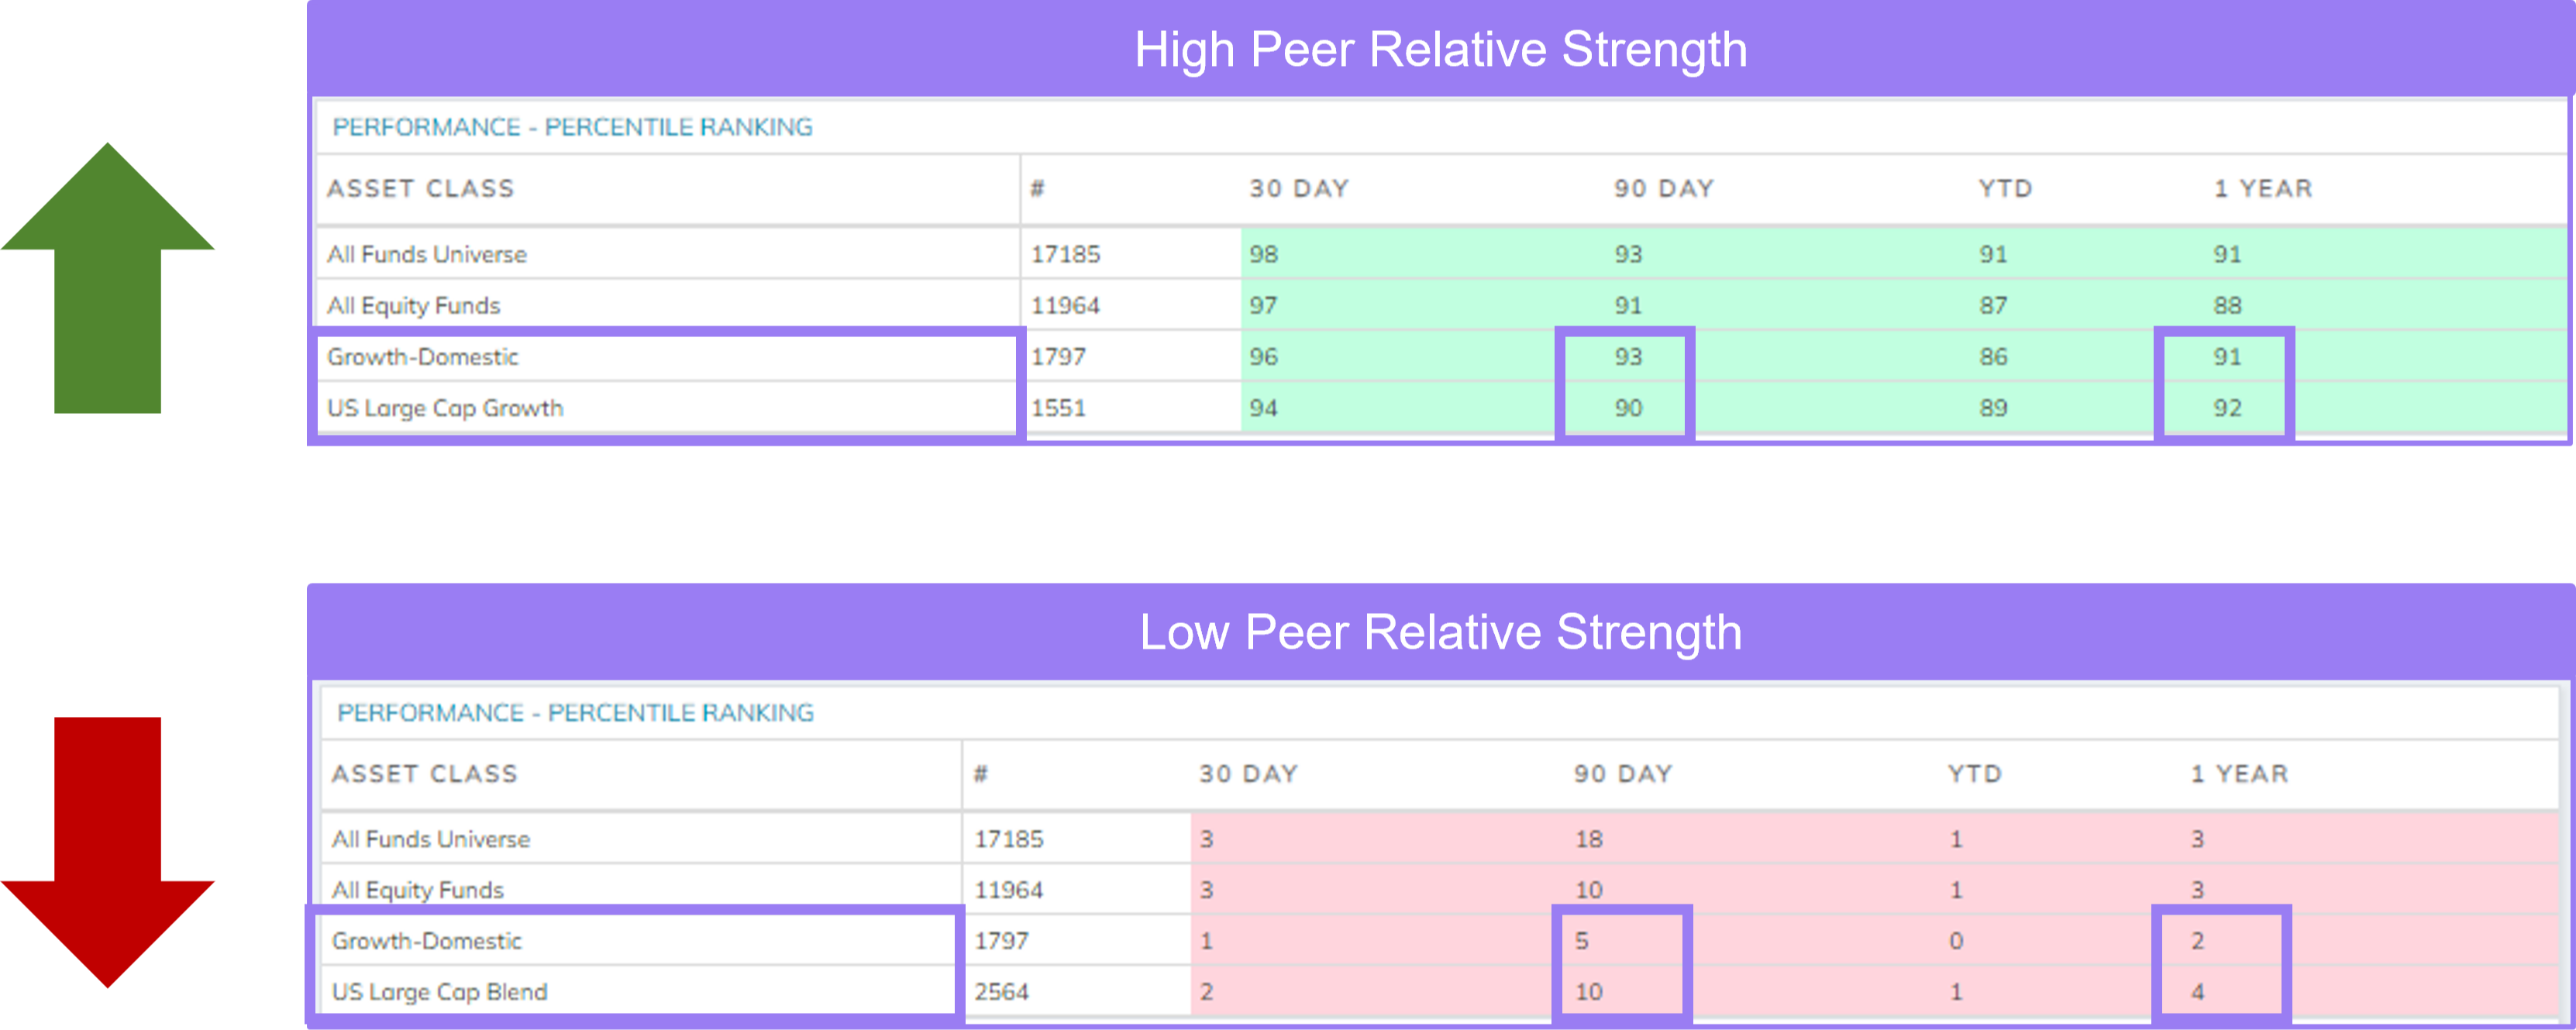
Similar to part of the Market Relative Strength analysis, to determine a fund’s Peer Relative Strength, we look at its relative performance over the last 90 days and 1 year. However, instead of the broad universes of funds used for Market Relative Strength analysis, more targeted groups consisting of funds with similar characteristics to this fund are evaluated.
All else equal, the fund shown here on the top will have a higher score than the fund on the bottom since it has performed better relative to other similar funds over the last 90 days and the last year.
Peer Relative Strength helps us to drill down beyond Market Relative Strength analysis to really hone in on the specific funds we might want to invest in. Often a fund can have strong Market Relative Strength characteristics simply by being in a strong sector or market segment. As this research piece shows, while it certainly helps to be in the right area of the market, being in the right place is not always enough. Peer Relative Strength can help us differentiate further between the funds to find the strongest funds in the strongest segments of the market.